Evidence
In the past year , databricks, delta, dashboard, duckdb, wasm, polars , iceberg , flink , rust … one thing led to another and I ended up landing on evidence.dev. The documentation is clean and to the point. But requires some effort to get started with other data sources. It took me a few hours to get the data from databricks because I missed some of the environment variables settings for databrics. Getting duckdb to work is easy. Otherwise, it was a breeze to get started with evidence.dev.
Installation
Refer to the installation guide for more details.
Customisation
Add a file page/+layout.svelte to customise the layout of the page. There is further documentation on the layout page.
A basic layout file for the common tasks
- Remove queries
- Full width
- Title
+layout.svelte
<EvidenceDefaultLayout
    {data}
    title="Vish"
    fullWidth={true}
    neverShowQueries={true}
    builtWithEvidence={true}
>
  <slot slot="content" />
</EvidenceDefaultLayout>
Databricks
Databricks SQL Warehouse is a cloud-based data warehousing solution from Databricks. It is a fully managed, serverless, and highly scalable data warehouse that allows you to query and analyze data using standard SQL. Evidence can use Databricks as a data source.
Add Databricks as a data source
Add a folder sources/databricks_admin_workspace and create a file pages/databricks_admin_workspace/connection.yaml with the following content.
I have used one source for workspace as there might be RBAC per workspace and Unity Catalog. This page uses the System Tables in databricks to visualise the usage, cost and other metrics.
Other sources can be added for different workspaces that could be used to create BI dashboards for different teams.
sources/databricks_admin_workspace/connection.yaml
name: databricks_admin_workspace
type: databricks
Environment Variables
I did spend some time to get the databricks to work. It was my mistake to not read the documentation properly. The environment variables are required to be set for databricks.
.env / .envrc
export EVIDENCE_SOURCE__databricks_admin_workspace__host="adb-<workspace-id>.azuredatabricks.net"
export EVIDENCE_SOURCE__databricks_admin_workspace__port="443"
export EVIDENCE_SOURCE__databricks_admin_workspace__path="/sql/1.0/warehouses/<warehouse_id>"
export EVIDENCE_SOURCE__databricks_admin_workspace__token="<personal_access_token>"
Source Query
Refer to the Source Queries for more details. To use the system.billing.usage table in databricks, the following query can be used. The source queries only select the columns that are required for the visualisation. It is possible to have aggregations and other transformations in the source query. The transformations can be SQL in duckdb queries or called SQL Queries
sources/databricks_admin_workspace/billing_usage.sql
select usage_date as dt, usage_start_time as start, workspace_id as id,
sku_name, usage_quantity
from system.billing.usage
BI as Code
The main USP of evidence.dev is the ability to write SQL queries and visualise the data. What drew me most towards evidence is the ability to use Markdown and SQL to create static pages ( with dynamic behaviour) for BI dashboards. Some of the advantages
- Only requires knowledge of SQL and Markdown
- Unit tests can be written for the SQL queries.
- CI/CD and BI as Code
- Git Ops
- Version Control
- Audit
- Reproducibility
SQL Queries
Refer to docs.evidence.dev. To create data for a bar chart, we must create a sql query refers to the tables created using the source queries. We can use databricks_admin_workspace.billing_usage as a table.
1.Add a file queries/daily_usage_today.sql
queries/daily_usage_today.sql
select date_trunc('hour',start) as dt, id, sum(usage_quantity) as cost
from databricks_admin_workspace.billing_usage where dt = current_date
group by all
2.Add the query in the frontmatter of the page
pages/index.md
---
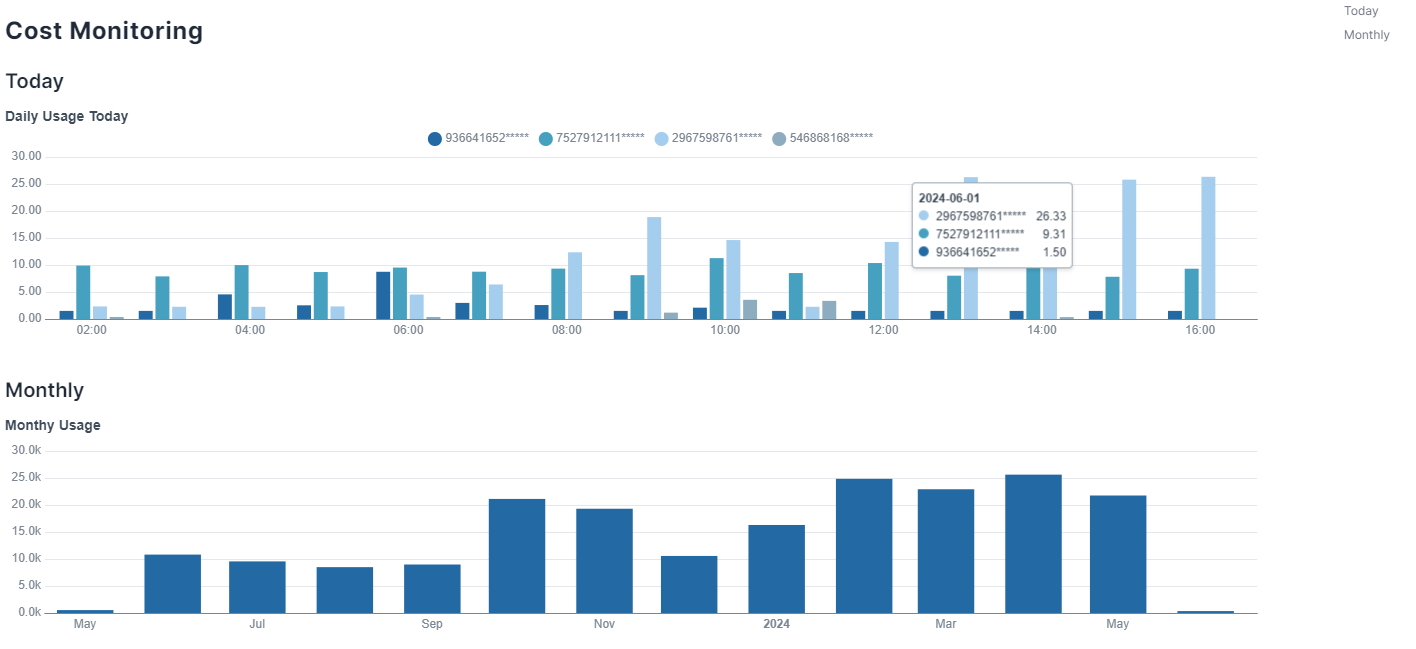
title: Cost Monitoring
queries:
- daily_usage_today.sql
---Visualisation
With the source queries and sql queries in place, we can now visualise the data using evidence ui components
<BarChart
    data={daily_usage_today}
    title='Daily Usage Today'
    x=dt
    y=cost
    series=name
    type=grouped
/>
And that's it. We have a dashboard for databricks.
CI / CD
There are multiple ways to deploy which depends on the infrastructure. The basics are
- Build using
npm run sources && npm run build - Package the static files generated in the folder
buildfolder. - Deploy the static files to the server.
- Update as required as evidence is a static site generator.
Source Code
The source code for PoC Project can be found here